| Seqrite Dashboard |
| Seqrite Dashboard |
Seqrite Endpoint security has a web-based graphical console that displays the current status of the health of endpoints and highlights critical security situations that need immediate attention.
This section explains how to navigate the Web console.
When you log on to the Seqrite Endpoint Security console, the Home page is displayed by default. The options that appear on the console are as follows:

The menu bar on the upper-right corner, highlighted in yellow, includes the following options that are common to all pages:
Menu |
Description |
Admin Settings |
Helps you configure the settings related to the features such as Server and Endpoints. |
Support |
Helps you find out all the support options that Seqrite provides. |
Help |
Includes the Help file that provides information about all the features, how they work, and how to configure them. |
Logout |
With this button, you can log out from the current session. |
Product name:

The product name section includes the following:
Menu |
Description |
Product Name and Version |
Displays the product name and its current version. |
Tabs:

The user interface of the web console also includes the links to the following pages:
Pages |
Description |
Home |
Helps you visit the Home page, which is the Seqrite Endpoint Security Dashboard. |
Clients |
Helps you configure the settings related to Endpoint Status and Endpoint Action. |
Settings |
Helps you configure the settings related to Endpoint Settings and Schedule Settings. |
Reports |
Helps you generate reports on all the features that you need. |
Alerts (Bell Icon) |
Displays alert messages for the following critical situations: · Update Manager not updated · License expired · License limit exceeded · License about to expire · New service pack available · SMS credit limit has been reached to maximum |
Messenger |
Displays the messages related to security information, new service pack released, new SEPS version released etc. |
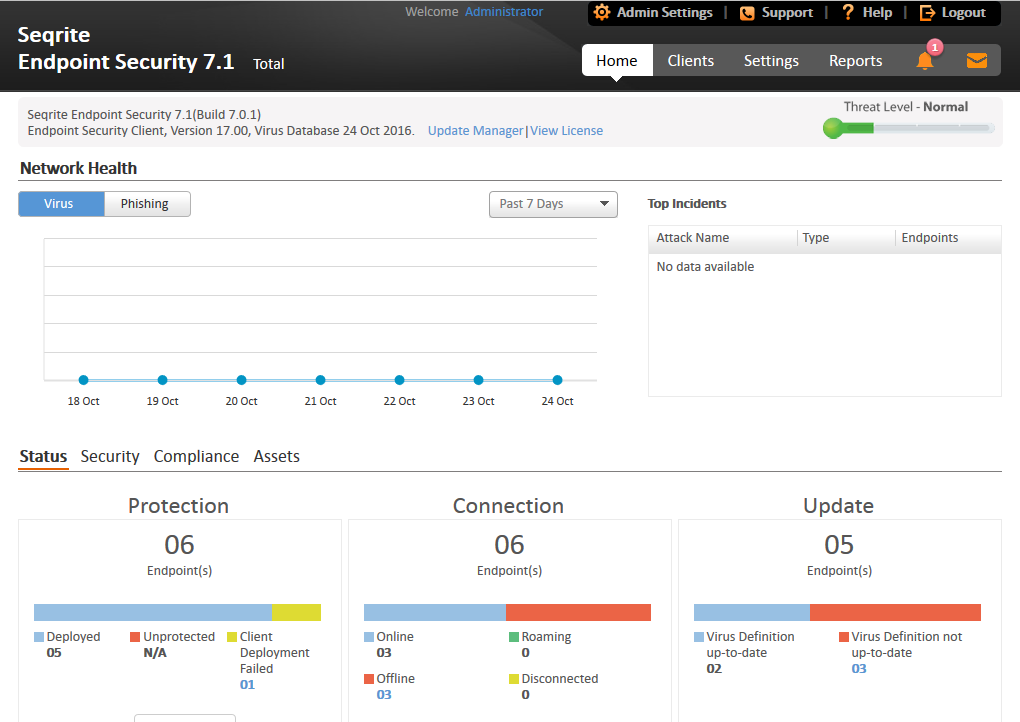
The Dashboard area on the Home page has widgets for the following.
Features |
Description |
Product version |
Displays the product version along with the build number. The build number is useful for troubleshooting purposes. The EPS service Pack information is also available. The virus database date included helps in understanding if your version is updated or whether it needs updates. |
Update Manager |
Link for running the Update Manager. For more information, see Update Manager. |
View license |
Displays the links for: · Status: Displays currently held licensee information, installation number, product key,product type, validity and the maximum number of Endpoints permitted. · License order form: Displays the License order form to order new feature/license · License History: Displays the license history details. |
Threat Level |
Displays current threat level of your network. The threat levels include: · Normal: Indicates that 12% of the endpoints detected viral infection in last 24 hours. · Elevated: Indicates that 24% of the endpoints detected viral infection in last 24 hours. · High: Indicates that 36% of the endpoints detected viral infection in last 24 hours. · Critical: Indicates that more than 36% of the endpoints detected viral infection in last 24 hours. Important: Thorough scanning of the entire network is recommended if the threat level alert is High or Critical. |
Alert |
An alert appears if the health of the network needs an immediate action. Click the More link to see all the alerts. (The More link is displayed only if multiple alerts are available.) You can take appropriate action to fix the issue. |
Features |
Description |
Network Health |
Graphical representation of the network health for the categories of Virus and Phishing. Click the respective tab to get the details of that category. It shows how secure your system is currently. This status is displayed over a 4-level grid by colored dots that are in ascending level with green at the lowest level and red at the highest level. These colored dots indicate the following: · Green (Normal): Indicates endpoint is not infected and is secure. · Yellow (Elevated): Indicates low level of endpoint infection. · Orange (High): Indicates high level of endpoint infection that requires immediate action. · Red (Critical): Indicates critical level of endpoint infection that requires immediate action. The right pane carries a table with Top Attacks, the type and the total number of endpoints affected. |
View for drop down list |
Gives a graphical representation of the network health for the selected time period. The graphs can be viewed for the following time periods: · Past 7 Days: Displays the report of the last seven days. · Today: Displays the report of the today’s infection. · Past 15 Days: Displays the report of the last 15 days. · Past 30 Days: Displays the report of the last 30 days. |
Top Attacks |
Displays the top attacks on computers by Attack Name, type, and number of endpoints infected. Clicking on the endpoint count, opens a window with details of the actual endpoint infected. |
Features |
Description |
Status Tab |
Displays the information for the following categories: · Protection · Connection · Update |
Protection |
Displays the number of endpoints deployed in the network, unprotected endpoints across your network, and the endpoints on which deployment of any client has failed. |
Connection |
Displays the total number of connections registered to the system with the break-up for online, offline, disconnected, and roaming endpoints. It also displays information about offline, disconnected, roaming endpoints and when they were last connected to the computer. |
Update |
Displays the number of endpoints on which the virus definitions are not up-to-date. Click the number under the category to check information about the Endpoint name, Domain, IP address, and Virus Database date. |
Enumerate |
Click Enumerate to generate a list of all the unprotected endpoints connected to the network. Note: This may take some time and a link to a list of all these endpoints with their endpoint name, domain name, and operating system platform name will be displayed. |
Features |
Description |
Security Tab |
Displays the protection status for the following : · Virus protection · Phishing protection · Browsing Protection |
Web Security |
Displays the information for top 5 Web site categories which were blocked in past 7 days in graph and a list of the top 5 Web sites which were blocked in past 7 days in a table with URL, Type and Count columns. Note: This feature is optional and will be visible only if you have purchased the license for Web Security feature. For more information, see Web Security. |
Data Loss Prevention |
Displays the number of data leak attempts over the last 7 days and a list of the top users who were trying to leak the data. Note: This feature is optional and will be visible only if you have purchased the license for DLP feature. For more information, see Data Loss Prevention. |
Vulnerabilities |
Displays the number of affected endpoints and a comparative list of the top vulnerabilities, severity level, and the total number of vulnerabilities detected. Also, displays a graphical widget for the listed data. |
Patch Management |
Displays the number of missing and installed patches by severity. |
Features |
Description |
Advanced Device Control |
Displays the information for top device types that breached the policies in the past 7 days and a list of the top 5 user, who breached the policy, specifying their user name, endpoint name, and the count of breaches. |
Application control |
Displays the information for top applications that were blocked in the past 7 days and a list of top 5 users who attempted to access the blocked applications specifying their user name, endpoint name, and count. |
Features |
Description |
Hardware changes |
Displays the number of hardware changes detected on SEPS 7.2 endpoints only for the endpoints with Windows and Linux operating systems. |
Software changes |
Displays the number of software changes detected on SEPS 7.2 endpoints only for the endpoints on Windows and Linux operating systems. |
Platforms |
Displays the total number of endpoints installed on a platform. Click the columns in the bar graph to display extended information related to a specific category. The endpoint IP address is displayed along with the platform on which it was installed. Note: This feature is applicable to all endpoints for Windows, Linux, and MAC operating systems. |
Software Installed |
Displays the number of endpoints on which software have been installed. This display is also in the form of a bar graph which can be toggled to display the number of software least installed v/s the number of software most installed. Click the columns in the bar graph to display more information related to the category. The endpoint IP address is displayed along with the software name. This feature is applicable only for endpoints with Windows and Linux operating systems. |